EXHIBIT 99.2
Published on
Exhibit 99.2

Prediction of Retinal Sensitivity Changes Following Treatment in BEST Disease George Magrath,
MD Retina in Rio 2026

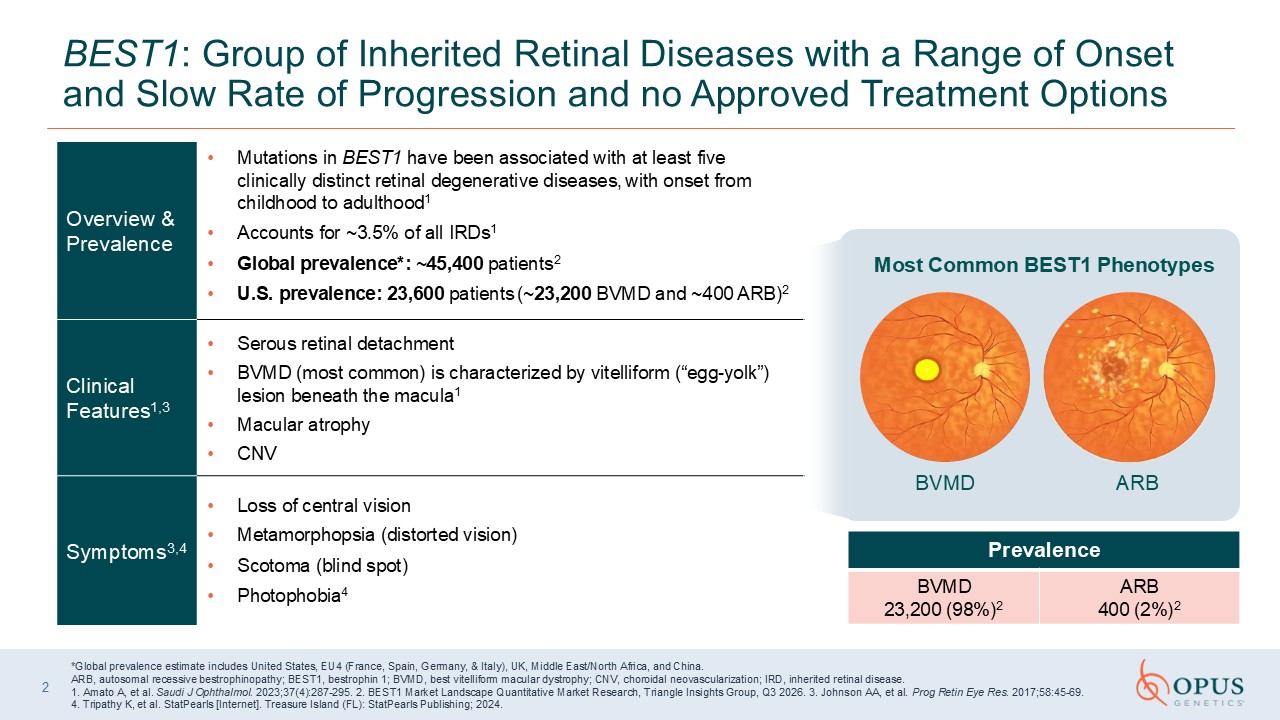
2 BEST1: Group of Inherited Retinal Diseases with a Range of Onset and Slow Rate of Progression
and no Approved Treatment Options Overview & Prevalence Mutations in BEST1 have been associated with at least five clinically distinct retinal degenerative diseases, with onset from childhood to adulthood1 Accounts for ~3.5% of all
IRDs1 Global prevalence*: ~45,400 patients2 U.S. prevalence: 23,600 patients (~23,200 BVMD and ~400 ARB)2 Clinical Features1,3 Serous retinal detachment BVMD (most common) is characterized by vitelliform (“egg-yolk”) lesion beneath
the macula1 Macular atrophy CNV Symptoms3,4 Loss of central vision Metamorphopsia (distorted vision) Scotoma (blind spot) Photophobia4 *Global prevalence estimate includes United States, EU4 (France, Spain, Germany, & Italy),
UK, Middle East/North Africa, and China. ARB, autosomal recessive bestrophinopathy; BEST1, bestrophin 1; BVMD, best vitelliform macular dystrophy; CNV, choroidal neovascularization; IRD, inherited retinal disease. 1. Amato A, et al. Saudi
J Ophthalmol. 2023;37(4):287-295. 2. BEST1 Market Landscape Quantitative Market Research, Triangle Insights Group, Q3 2026. 3. Johnson AA, et al. Prog Retin Eye Res. 2017;58:45-69. 4. Tripathy K, et al. StatPearls [Internet]. Treasure
Island (FL): StatPearls Publishing; 2024. BVMD ARB Most Common BEST1 Phenotypes Prevalence BVMD 23,200 (98%)2 ARB 400 (2%)2

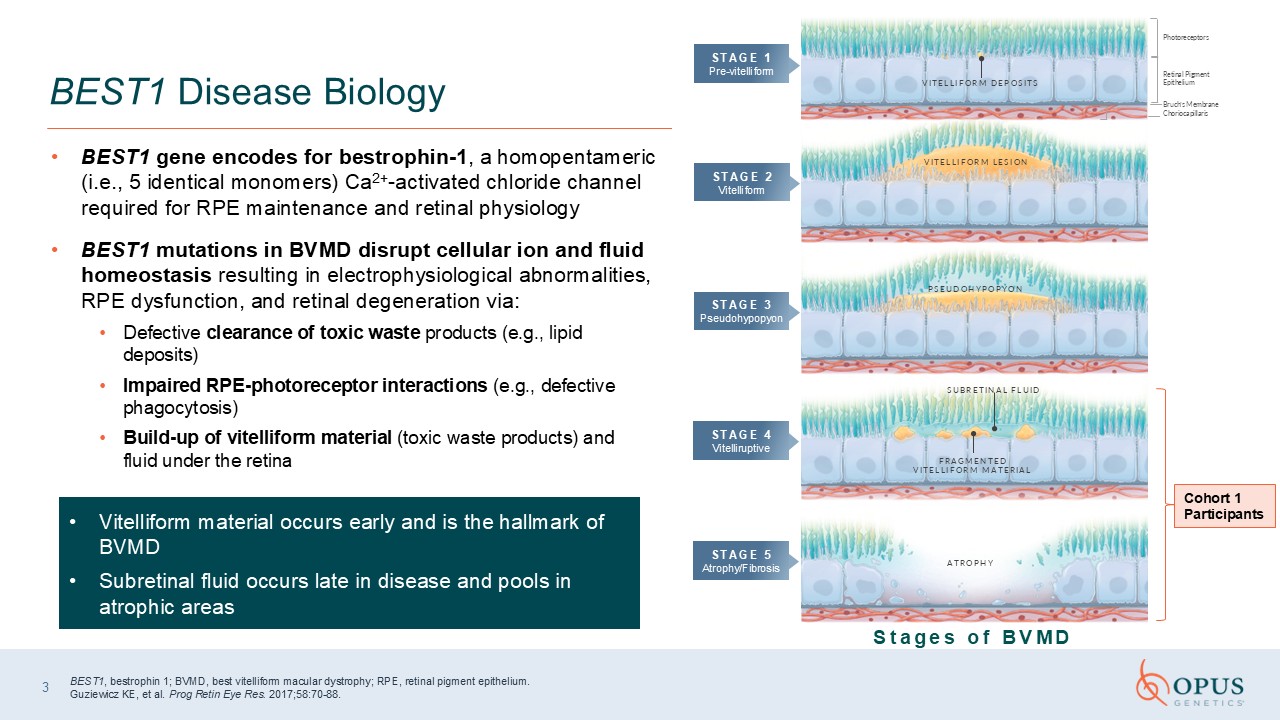
BEST1 gene encodes for bestrophin-1, a homopentameric (i.e., 5 identical monomers)
Ca2+-activated chloride channel required for RPE maintenance and retinal physiology BEST1 mutations in BVMD disrupt cellular ion and fluid homeostasis resulting in electrophysiological abnormalities, RPE dysfunction, and retinal
degeneration via: Defective clearance of toxic waste products (e.g., lipid deposits) Impaired RPE-photoreceptor interactions (e.g., defective phagocytosis) Build-up of vitelliform material (toxic waste products) and fluid under the
retina BEST1 Disease Biology BEST1, bestrophin 1; BVMD, best vitelliform macular dystrophy; RPE, retinal pigment epithelium.Guziewicz KE, et al. Prog Retin Eye Res. 2017;58:70-88. ATROPHY FRAGMENTED VITELLIFORM MATERIAL SUBRETINAL
FLUID PSEUDOHYPOPYON Photoreceptors Retinal Pigment Epithelium Bruch’s Membrane Choriocapillaris VITELLIFORM LESION VITELLIFORM DEPOSITS STAGE 1 Pre-vitelliform STAGE 2 Vitelliform STAGE 3 Pseudohypopyon STAGE
4 Vitelliruptive STAGE 5 Atrophy/Fibrosis Stages of BVMD 3 Cohort 1 Participants Vitelliform material occurs early and is the hallmark of BVMD Subretinal fluid occurs late in disease and pools in atrophic areas

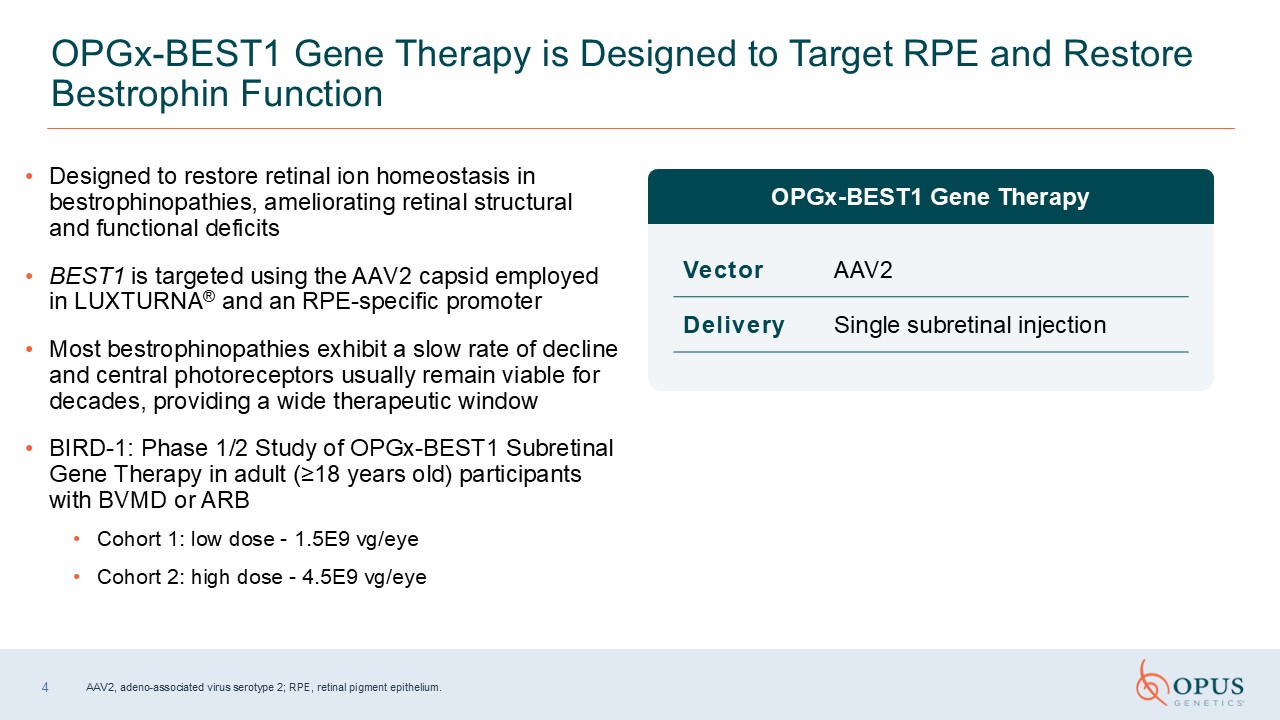
Designed to restore retinal ion homeostasis in bestrophinopathies, ameliorating retinal
structural and functional deficits BEST1 is targeted using the AAV2 capsid employed in LUXTURNA® and an RPE-specific promoter Most bestrophinopathies exhibit a slow rate of decline and central photoreceptors usually remain viable for
decades, providing a wide therapeutic window BIRD-1: Phase 1/2 Study of OPGx-BEST1 Subretinal Gene Therapy in adult (≥18 years old) participants with BVMD or ARB Cohort 1: low dose - 1.5E9 vg/eye Cohort 2: high dose - 4.5E9
vg/eye OPGx-BEST1 Gene Therapy is Designed to Target RPE and Restore Bestrophin Function OPGx-BEST1 Gene Therapy Vector AAV2 Delivery Single subretinal injection 4 AAV2, adeno-associated virus serotype 2; RPE, retinal pigment
epithelium.

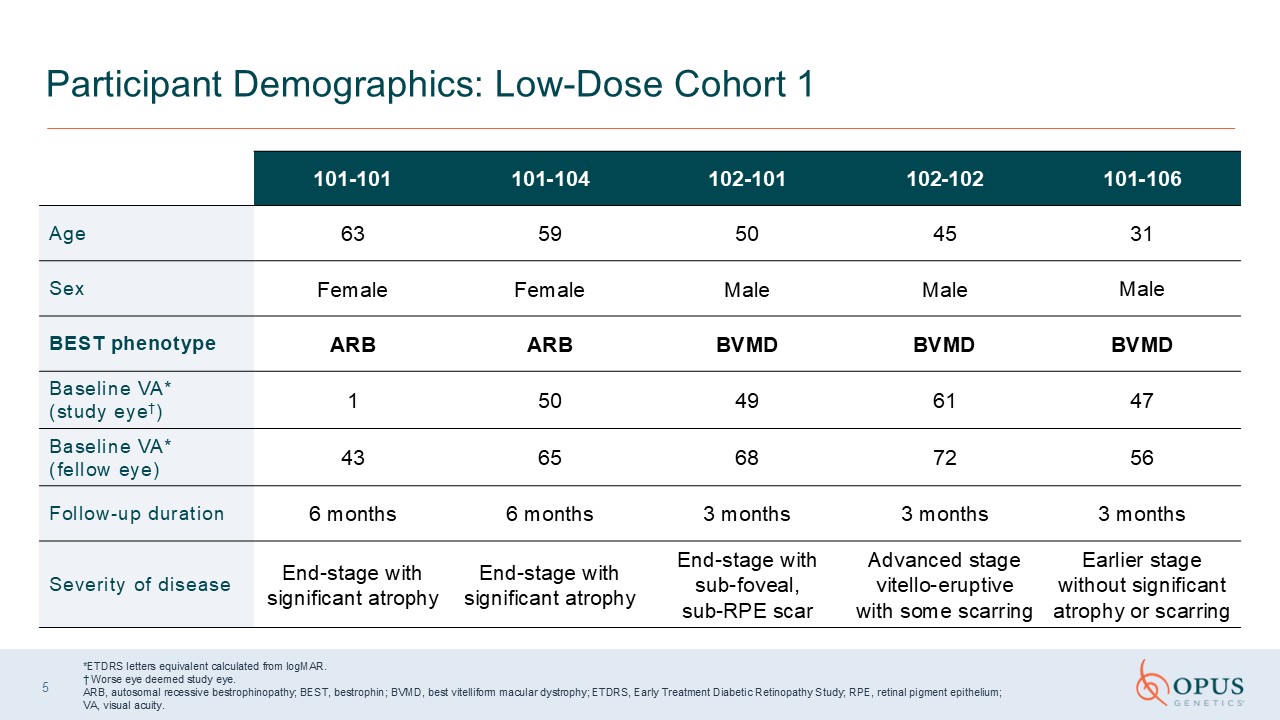
*ETDRS letters equivalent calculated from logMAR.†Worse eye deemed study eye. ARB, autosomal
recessive bestrophinopathy; BEST, bestrophin; BVMD, best vitelliform macular dystrophy; ETDRS, Early Treatment Diabetic Retinopathy Study; RPE, retinal pigment epithelium; VA, visual acuity. Participant Demographics: Low-Dose Cohort
1 101-101 101-104 102-101 102-102 101-106 Age 63 59 50 45 31 Sex Female Female Male Male Male BEST phenotype ARB ARB BVMD BVMD BVMD Baseline VA*(study eye†) 1 50 49 61 47 Baseline VA* (fellow
eye) 43 65 68 72 56 Follow-up duration 6 months 6 months 3 months 3 months 3 months Severity of disease End-stage with significant atrophy End-stage with significant atrophy End-stage with sub-foveal, sub-RPE scar Advanced
stage vitello-eruptive with some scarring Earlier stage without significant atrophy or scarring 5

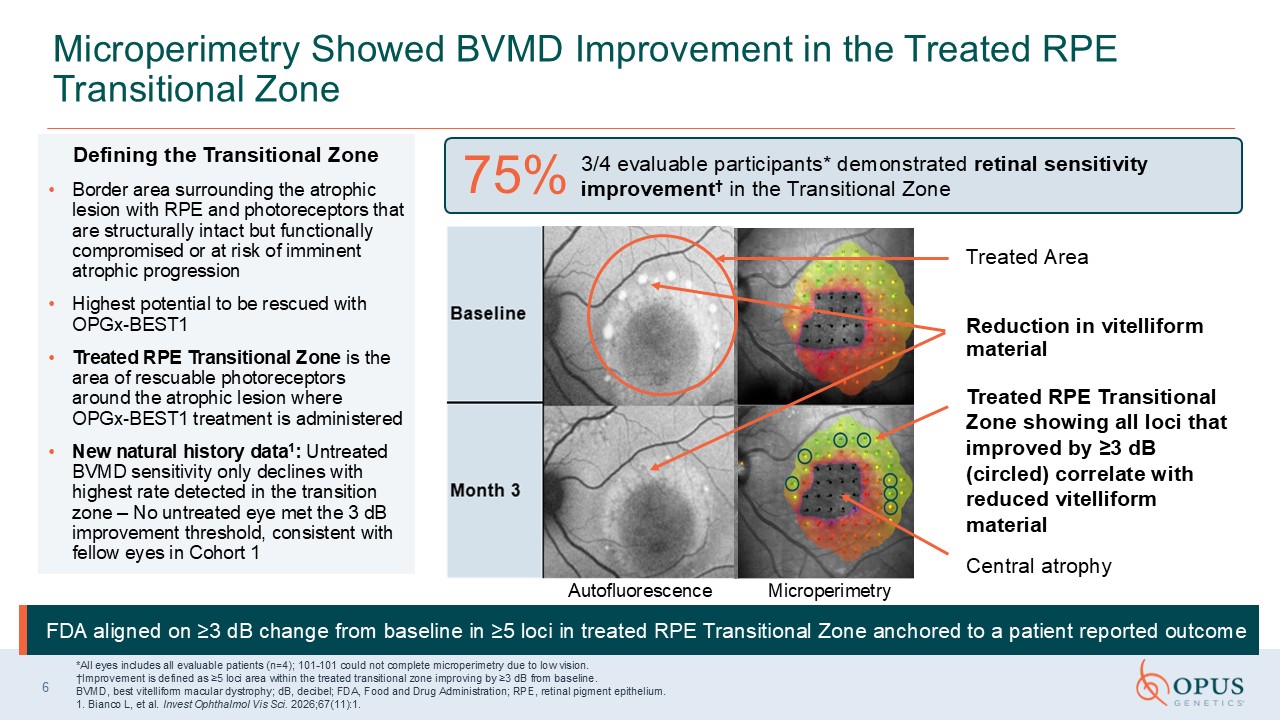
Defining the Transitional Zone Border area surrounding the atrophic lesion with RPE and
photoreceptors that are structurally intact but functionally compromised or at risk of imminent atrophic progression Highest potential to be rescued with OPGx-BEST1 Treated RPE Transitional Zone is the area of rescuable photoreceptors
around the atrophic lesion where OPGx-BEST1 treatment is administered New natural history data1: Untreated BVMD sensitivity only declines with highest rate detected in the transition zone – No untreated eye met the 3 dB improvement
threshold, consistent with fellow eyes in Cohort 1 Microperimetry Showed BVMD Improvement in the Treated RPE Transitional Zone *All eyes includes all evaluable patients (n=4); 101-101 could not complete microperimetry due to low
vision. †Improvement is defined as ≥5 loci area within the treated transitional zone improving by ≥3 dB from baseline.BVMD, best vitelliform macular dystrophy; dB, decibel; FDA, Food and Drug Administration; RPE, retinal pigment
epithelium. 1. Bianco L, et al. Invest Ophthalmol Vis Sci. 2026;67(11):1. 3/4 evaluable participants* demonstrated retinal sensitivity improvement† in the Transitional Zone 75% FDA aligned on ≥3 dB change from baseline in ≥5 loci in
treated RPE Transitional Zone anchored to a patient reported outcome Treated Area Central atrophy Treated RPE Transitional Zone showing all loci that improved by ≥3 dB (circled) correlate with reduced vitelliform
material Microperimetry Autofluorescence Reduction in vitelliform material 6

Transition Zone as a Microperimetry Endpoint

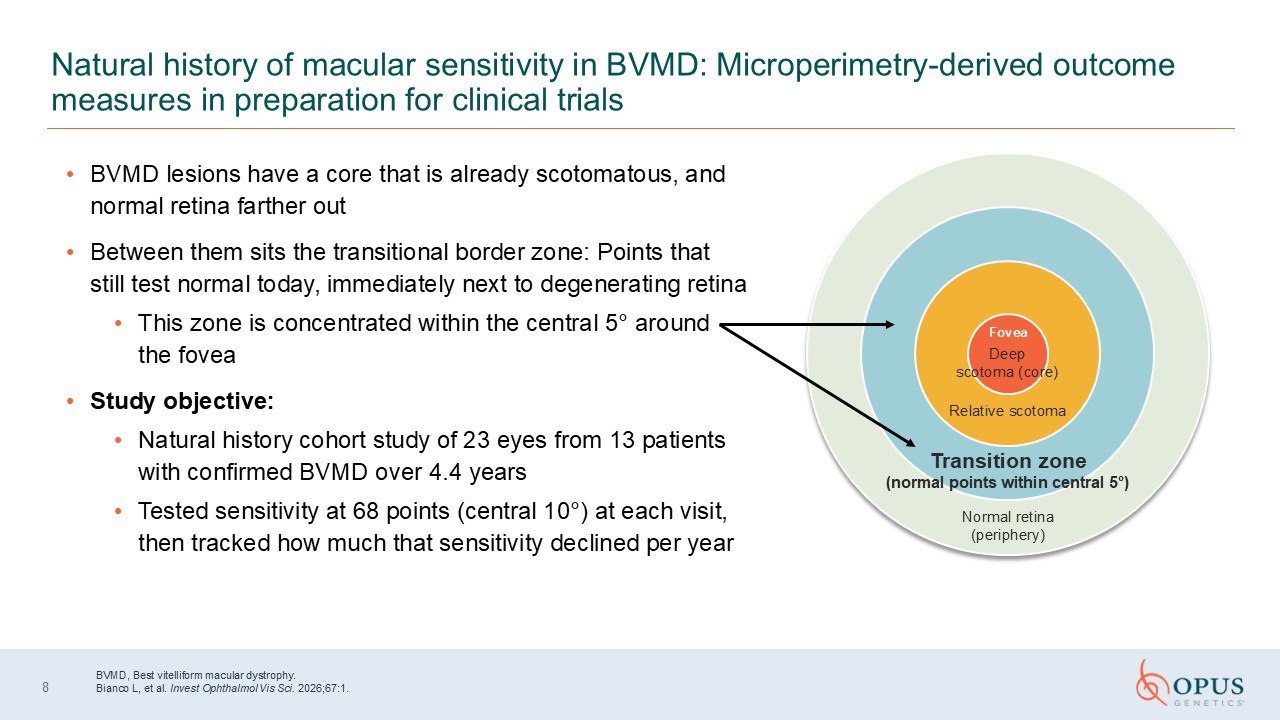
BVMD lesions have a core that is already scotomatous, and normal retina farther out Between
them sits the transitional border zone: Points that still test normal today, immediately next to degenerating retina This zone is concentrated within the central 5° around the fovea Study objective: Natural history cohort study of 23
eyes from 13 patients with confirmed BVMD over 4.4 years Tested sensitivity at 68 points (central 10°) at each visit, then tracked how much that sensitivity declined per year 8 Natural history of macular sensitivity in BVMD:
Microperimetry-derived outcome measures in preparation for clinical trials Fovea Deep scotoma (core) Relative scotoma Transition zone (normal points within central 5°) Normal retina (periphery) BVMD, Best vitelliform macular
dystrophy. Bianco L, et al. Invest Ophthalmol Vis Sci. 2026;67:1.

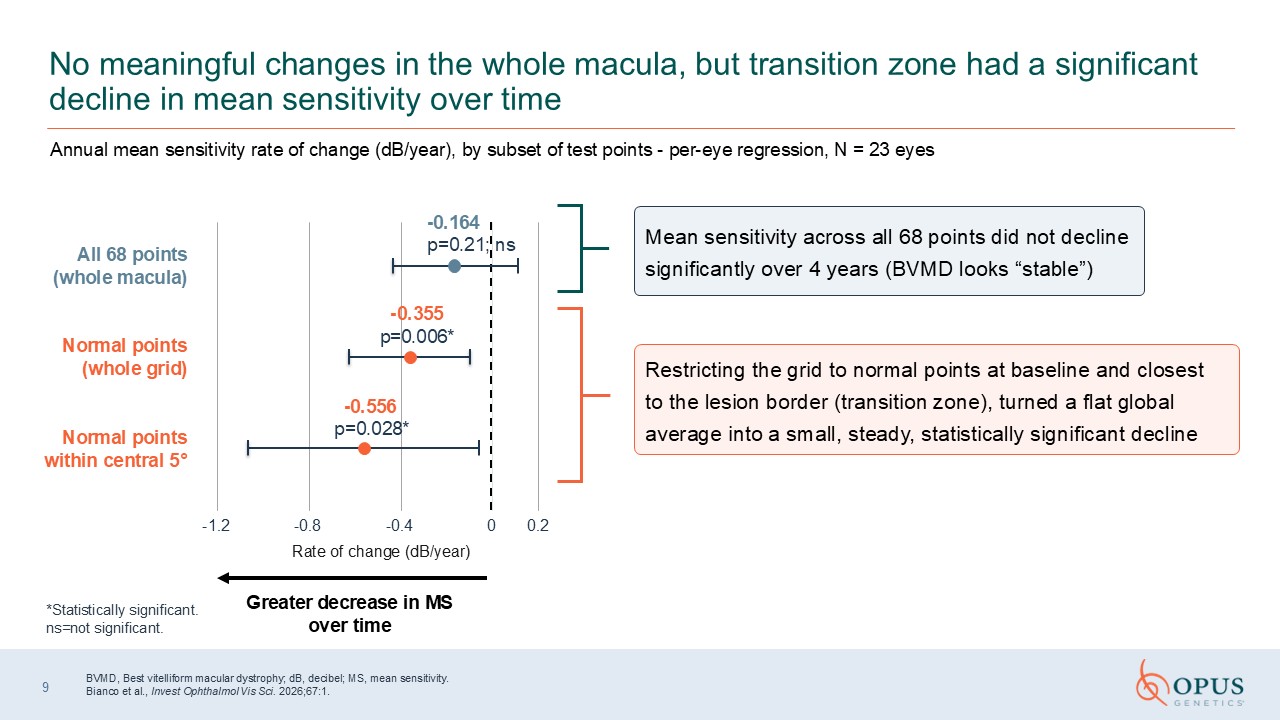
No meaningful changes in the whole macula, but transition zone had a significant decline in mean
sensitivity over time Annual mean sensitivity rate of change (dB/year), by subset of test points - per-eye regression, N = 23 eyes Mean sensitivity across all 68 points did not decline significantly over 4 years (BVMD looks “stable”)
*Statistically significant. ns=not significant. BVMD, Best vitelliform macular dystrophy; dB, decibel; MS, mean sensitivity. Bianco et al., Invest Ophthalmol Vis Sci. 2026;67:1. 9 Restricting the grid to normal points at baseline
and closest to the lesion border (transition zone), turned a flat global average into a small, steady, statistically significant decline -1.2 -0.8 -0.4 0 0.2 All 68 points (whole macula) -0.164 p=0.21; ns Normal points (whole
grid) -0.355 p=0.006* Normal points within central 5° -0.556 p=0.028* Rate of change (dB/year) Greater decrease in MSover time

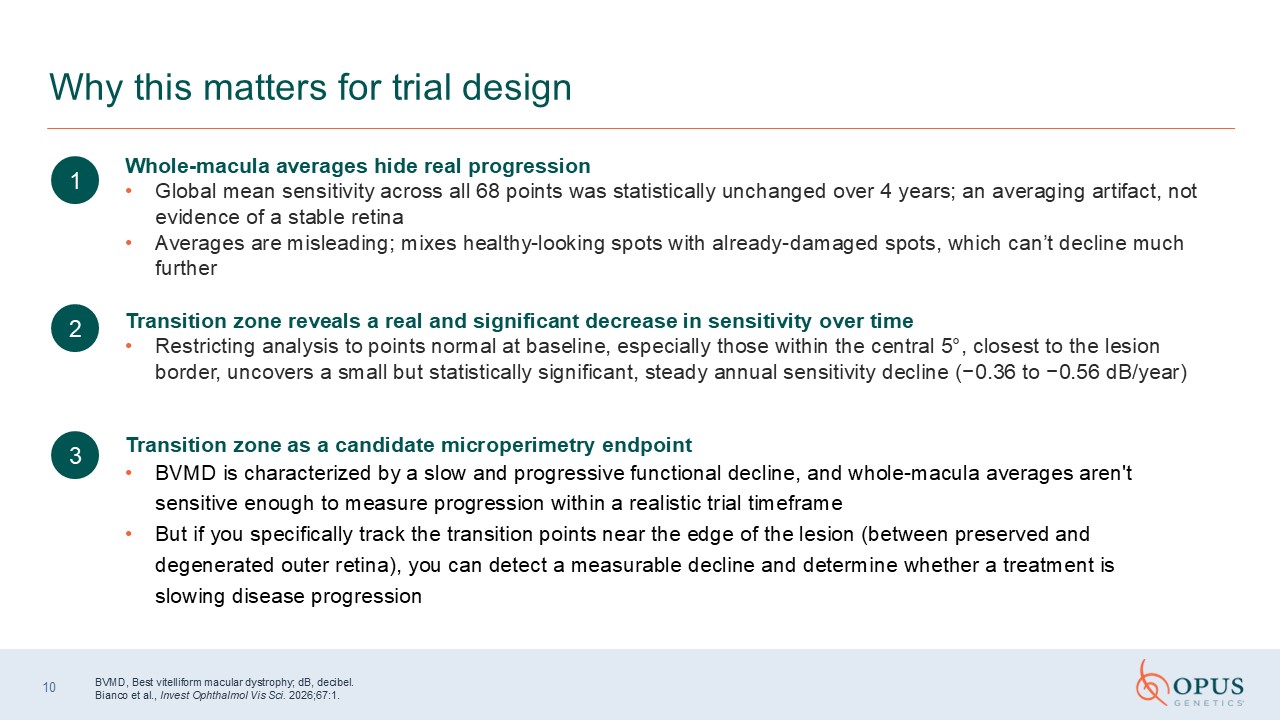
Why this matters for trial design 1 Whole-macula averages hide real progression Global mean
sensitivity across all 68 points was statistically unchanged over 4 years; an averaging artifact, not evidence of a stable retina Averages are misleading; mixes healthy-looking spots with already-damaged spots, which can’t decline much
further 2 Transition zone reveals a real and significant decrease in sensitivity over time Restricting analysis to points normal at baseline, especially those within the central 5°, closest to the lesion border, uncovers a small but
statistically significant, steady annual sensitivity decline (−0.36 to −0.56 dB/year) 3 Transition zone as a candidate microperimetry endpoint BVMD is characterized by a slow and progressive functional decline, and whole-macula averages
aren't sensitive enough to measure progression within a realistic trial timeframe But if you specifically track the transition points near the edge of the lesion (between preserved and degenerated outer retina), you can detect a
measurable decline and determine whether a treatment is slowing disease progression BVMD, Best vitelliform macular dystrophy; dB, decibel. Bianco et al., Invest Ophthalmol Vis Sci. 2026;67:1. 10

Learnings from the Ongoing Phase 1/2 Study of OPGx-BEST1

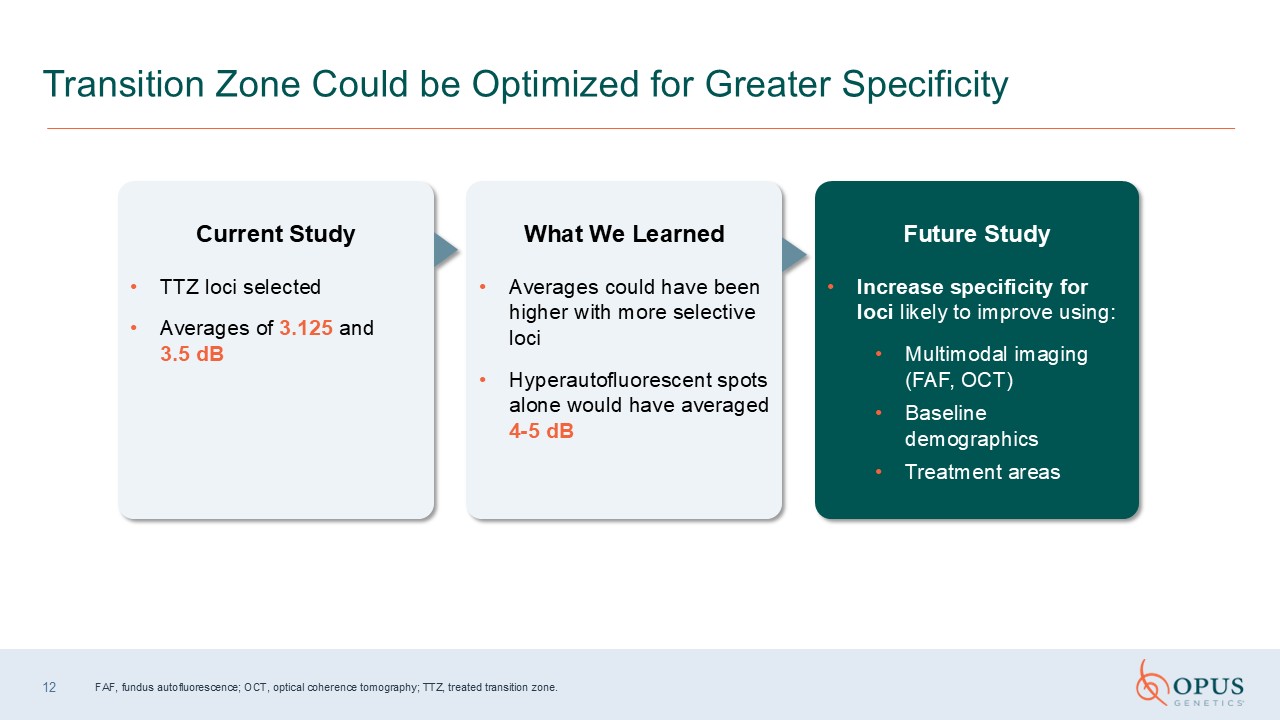
12 Transition Zone Could be Optimized for Greater Specificity Current Study TTZ loci
selected Averages of 3.125 and 3.5 dB What We Learned Averages could have been higher with more selective loci Hyperautofluorescent spots alone would have averaged 4-5 dB Future Study Increase specificity for loci likely to improve
using: Multimodal imaging (FAF, OCT) Baseline demographics Treatment areas FAF, fundus autofluorescence; OCT, optical coherence tomography; TTZ, treated transition zone.

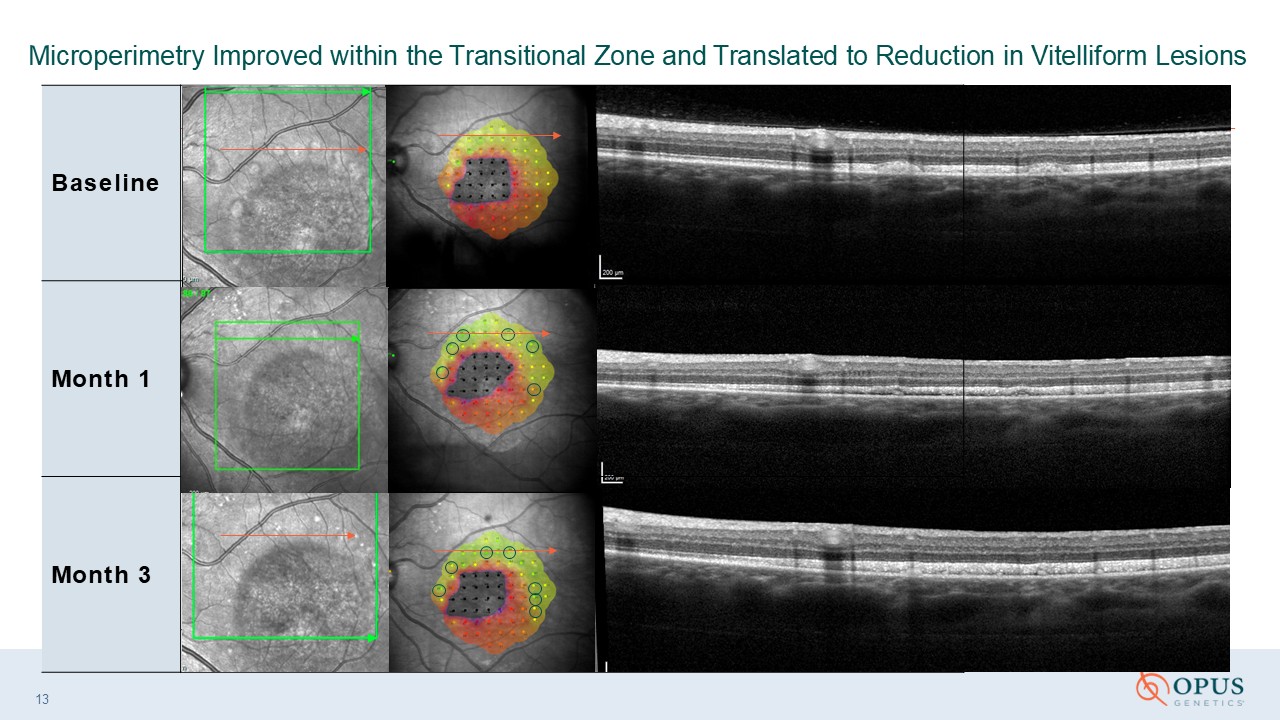
BVMD, best vitelliform macular dystrophy. Baseline Month 1 Month 3 Microperimetry Improved
within the Transitional Zone and Translated to Reduction in Vitelliform Lesions 13

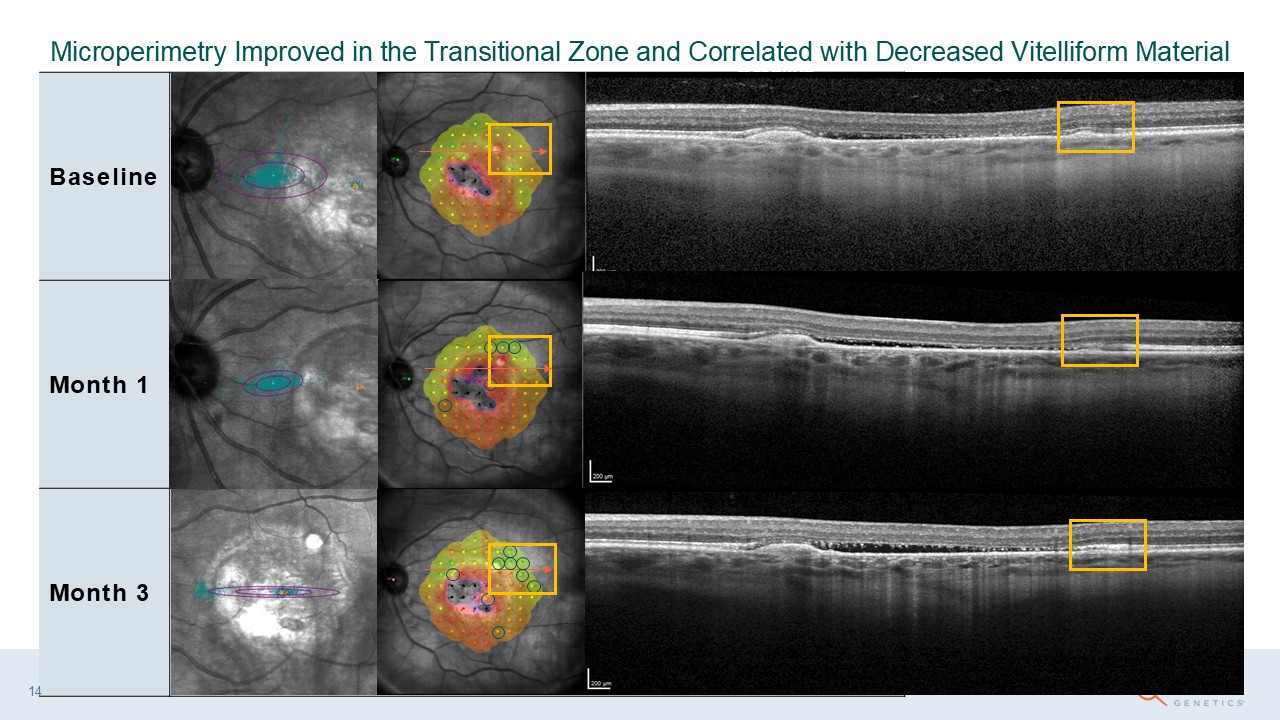
Baseline Month 1 Month 3 Microperimetry Improved in the Transitional Zone and Correlated with
Decreased Vitelliform Material Baseline Month 3 14

OCT-derived EZ-to-RPE Thickness as a Structural Endpoint

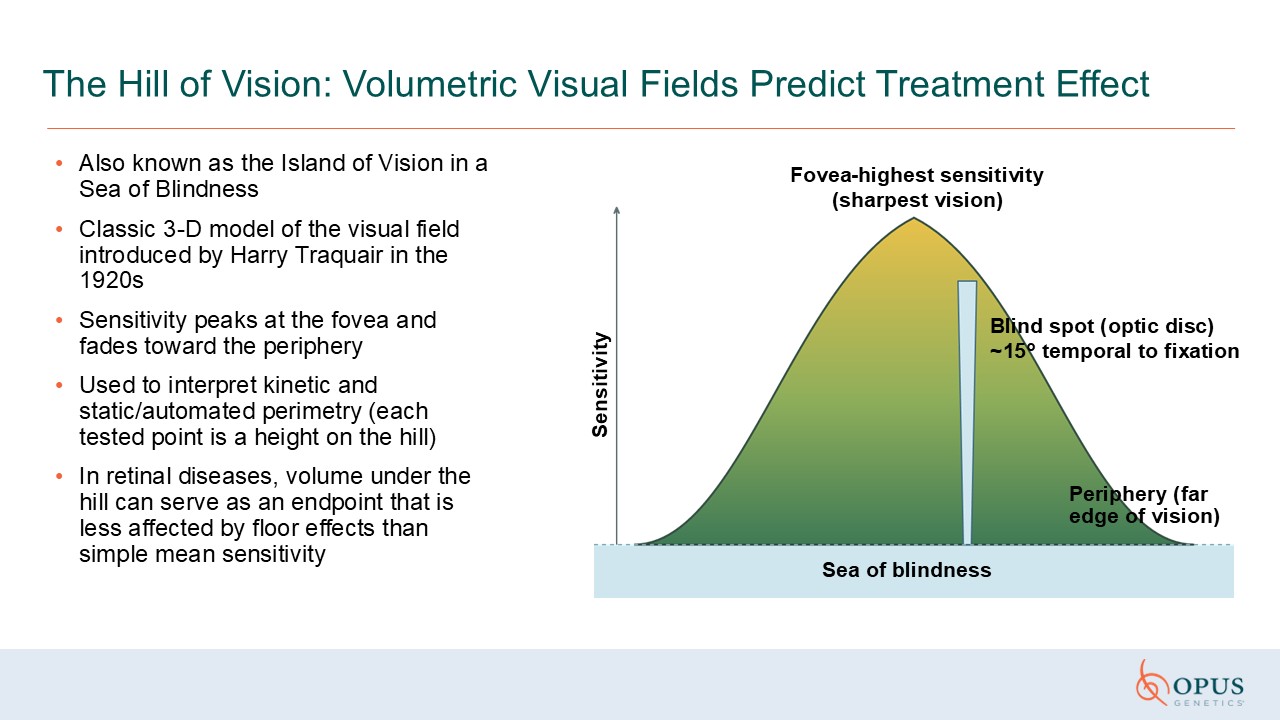
Fovea-highest sensitivity (sharpest vision) Blind spot (optic disc) ~15° temporal to
fixation Periphery (far edge of vision) Sensitivity Also known as the Island of Vision in a Sea of Blindness Classic 3-D model of the visual field introduced by Harry Traquair in the 1920s Sensitivity peaks at the fovea and fades
toward the periphery Used to interpret kinetic and static/automated perimetry (each tested point is a height on the hill) In retinal diseases, volume under the hill can serve as an endpoint that is less affected by floor effects than
simple mean sensitivity The Hill of Vision: Volumetric Visual Fields Predict Treatment Effect Sea of blindness

Learnings from the Ongoing Phase 1/2 Study of OPGx-BEST1

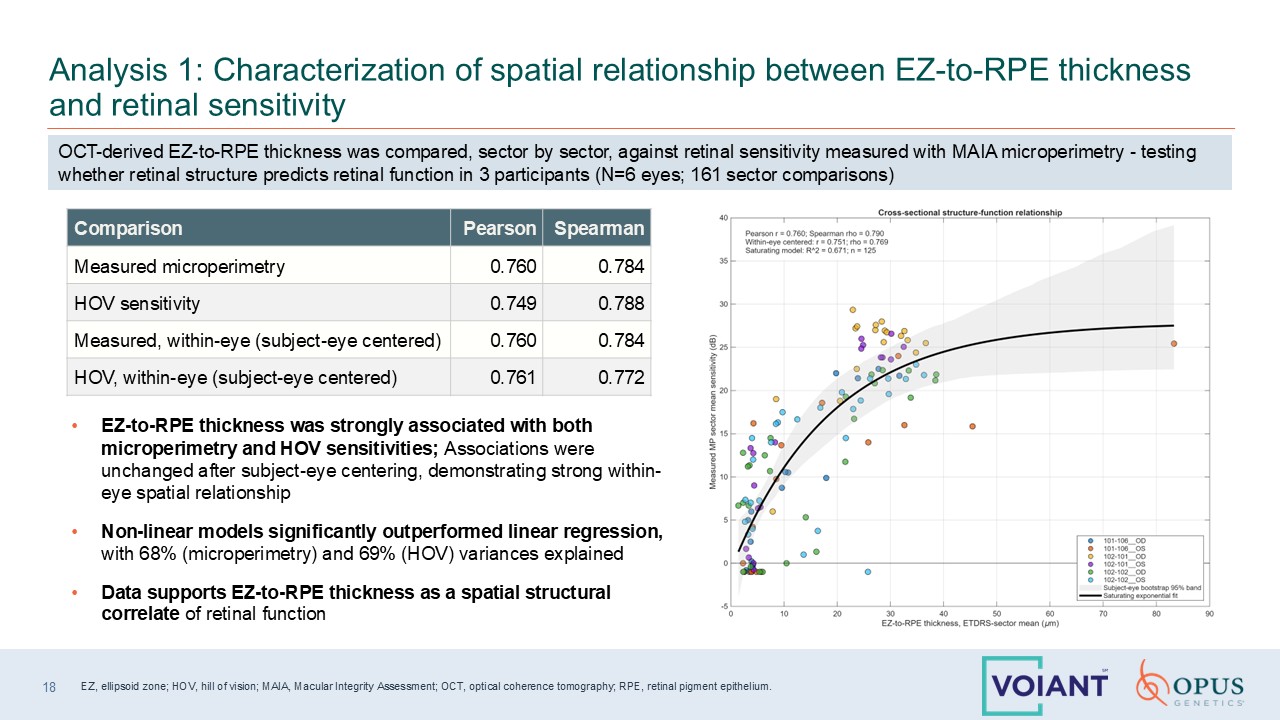
18 Analysis 1: Characterization of spatial relationship between EZ-to-RPE thickness and retinal
sensitivity Comparison Pearson Spearman Measured microperimetry 0.760 0.784 HOV sensitivity 0.749 0.788 Measured, within-eye (subject-eye centered) 0.760 0.784 HOV, within-eye (subject-eye centered) 0.761 0.772 EZ-to-RPE
thickness was strongly associated with both microperimetry and HOV sensitivities; Associations were unchanged after subject-eye centering, demonstrating strong within-eye spatial relationship Non-linear models significantly outperformed
linear regression, with 68% (microperimetry) and 69% (HOV) variances explained Data supports EZ-to-RPE thickness as a spatial structural correlate of retinal function OCT-derived EZ-to-RPE thickness was compared, sector by sector,
against retinal sensitivity measured with MAIA microperimetry - testing whether retinal structure predicts retinal function in 3 participants (N=6 eyes; 161 sector comparisons) EZ, ellipsoid zone; HOV, hill of vision; MAIA, Macular
Integrity Assessment; OCT, optical coherence tomography; RPE, retinal pigment epithelium.

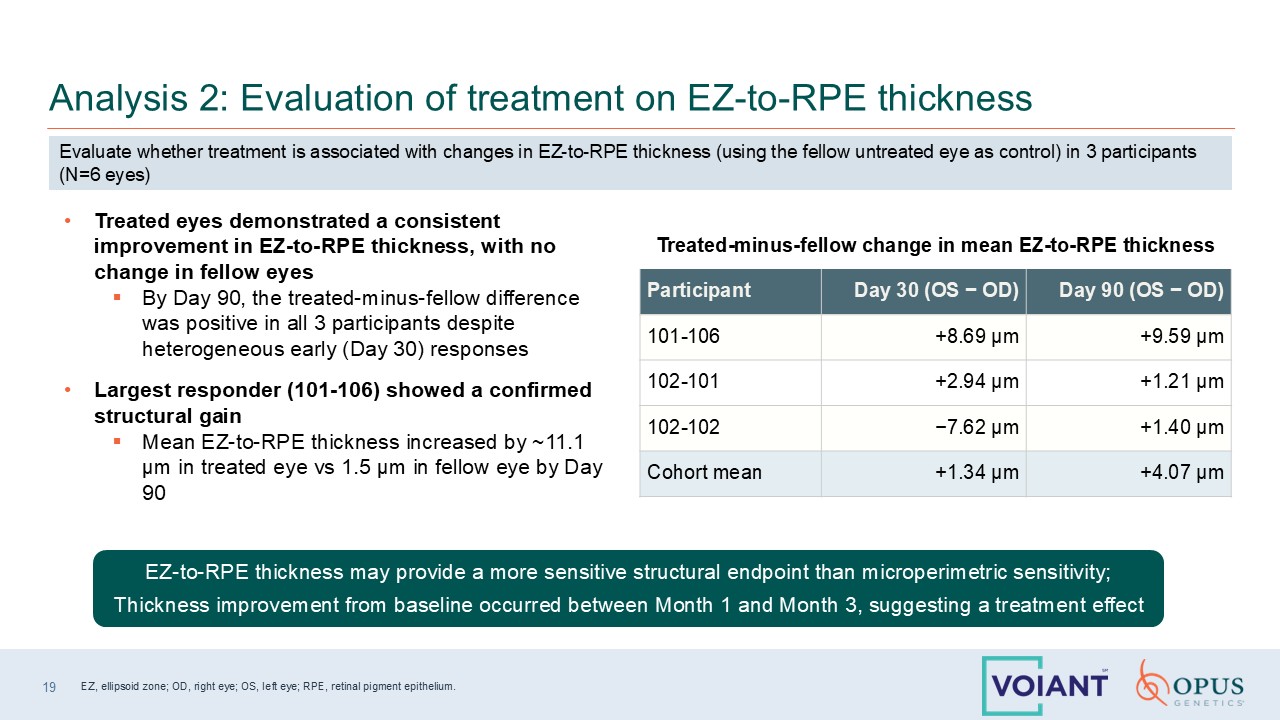
19 Analysis 2: Evaluation of treatment on EZ-to-RPE thickness Treated eyes demonstrated a
consistent improvement in EZ-to-RPE thickness, with no change in fellow eyes By Day 90, the treated-minus-fellow difference was positive in all 3 participants despite heterogeneous early (Day 30) responses Largest responder (101-106)
showed a confirmed structural gain Mean EZ-to-RPE thickness increased by ~11.1 µm in treated eye vs 1.5 µm in fellow eye by Day 90 Treated-minus-fellow change in mean EZ-to-RPE thickness Participant Day 30 (OS − OD) Day 90 (OS −
OD) 101-106 +8.69 µm +9.59 µm 102-101 +2.94 µm +1.21 µm 102-102 −7.62 µm +1.40 µm Cohort mean +1.34 µm +4.07 µm Evaluate whether treatment is associated with changes in EZ-to-RPE thickness (using the fellow untreated eye as
control) in 3 participants (N=6 eyes) EZ-to-RPE thickness may provide a more sensitive structural endpoint than microperimetric sensitivity; Thickness improvement from baseline occurred between Month 1 and Month 3, suggesting a treatment
effect EZ, ellipsoid zone; OD, right eye; OS, left eye; RPE, retinal pigment epithelium.

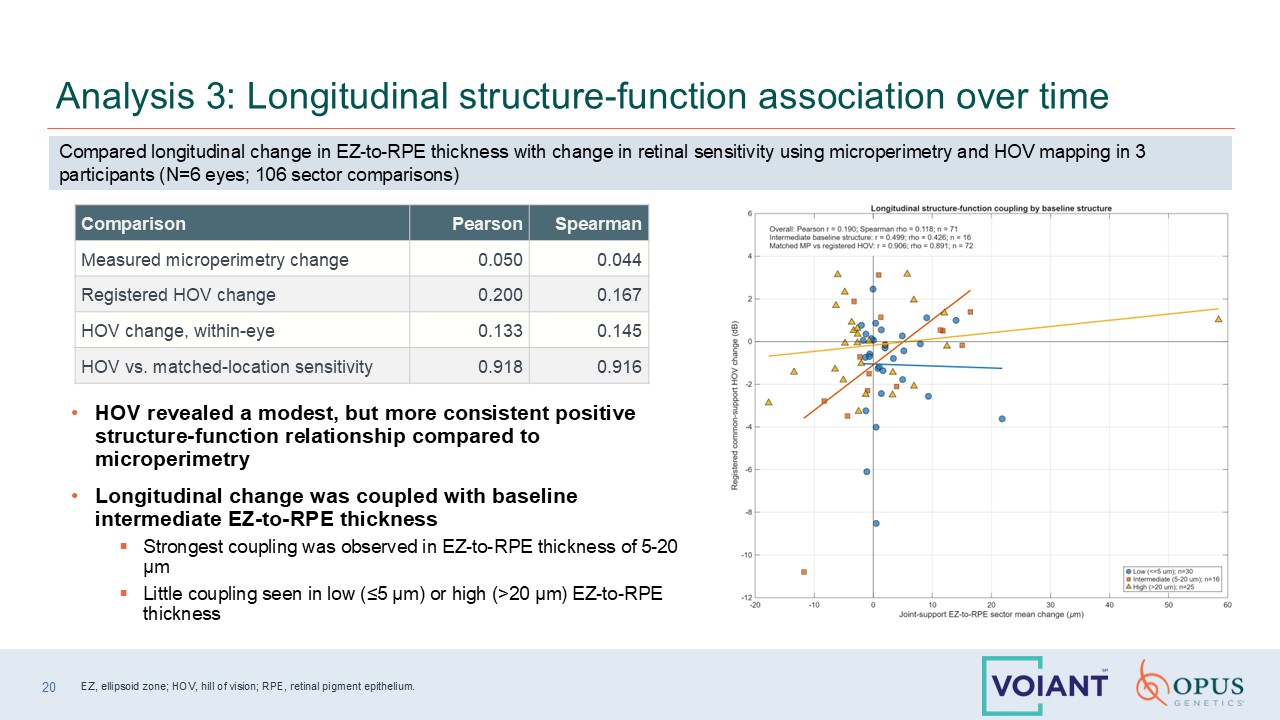
HOV revealed a modest, but more consistent positive structure-function relationship compared to
microperimetry Longitudinal change was coupled with baseline intermediate EZ-to-RPE thickness Strongest coupling was observed in EZ-to-RPE thickness of 5-20 µm Little coupling seen in low (≤5 µm) or high (>20 µm) EZ-to-RPE
thickness 20 Analysis 3: Longitudinal structure-function association over time Comparison Pearson Spearman Measured microperimetry change 0.050 0.044 Registered HOV change 0.200 0.167 HOV change, within-eye 0.133 0.145 HOV
vs. matched-location sensitivity 0.918 0.916 Compared longitudinal change in EZ-to-RPE thickness with change in retinal sensitivity using microperimetry and HOV mapping in 3 participants (N=6 eyes; 106 sector comparisons) EZ, ellipsoid
zone; HOV, hill of vision; RPE, retinal pigment epithelium.

OCT Biomarkers and Retinal Sensitivity in BVMD BVMD, best vitelliform macular dystrophy; OCT,
optical coherence tomography.

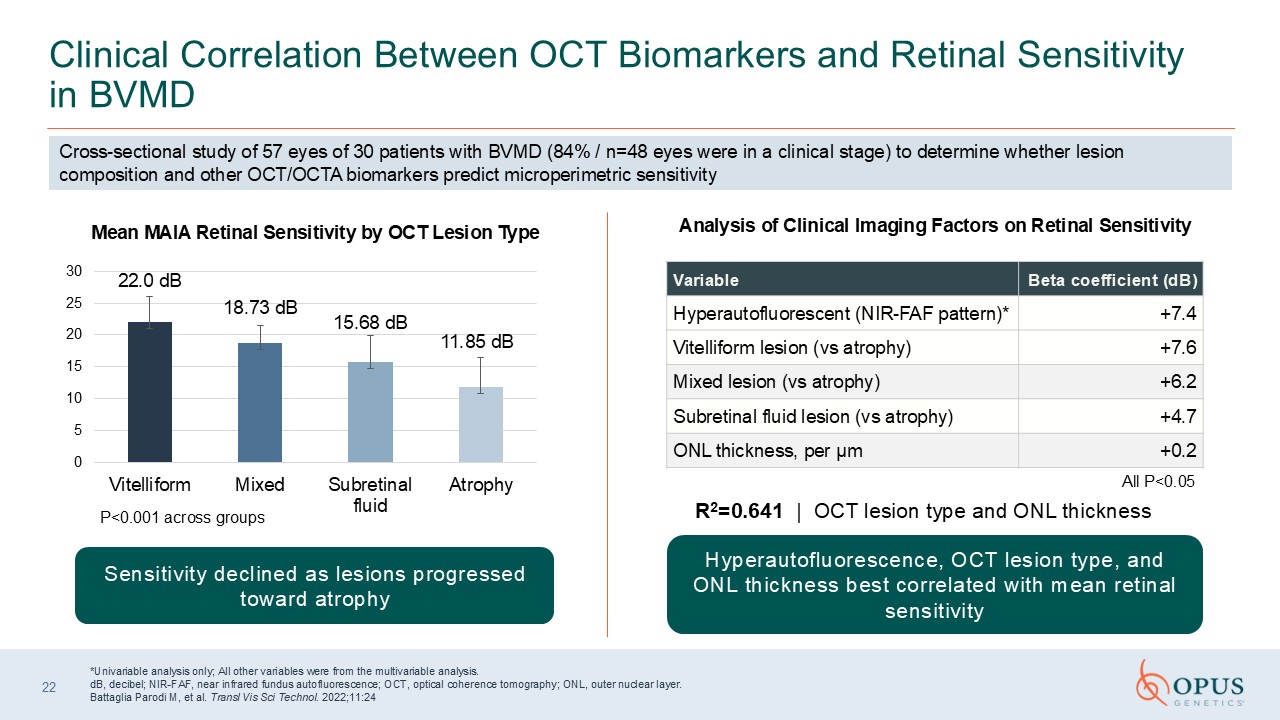
22 Clinical Correlation Between OCT Biomarkers and Retinal Sensitivity in BVMD Variable Beta
coefficient (dB) Hyperautofluorescent (NIR-FAF pattern)* +7.4 Vitelliform lesion (vs atrophy) +7.6 Mixed lesion (vs atrophy) +6.2 Subretinal fluid lesion (vs atrophy) +4.7 ONL thickness, per µm +0.2 P<0.001 across groups Mean
MAIA Retinal Sensitivity by OCT Lesion Type Sensitivity declined as lesions progressed toward atrophy *Univariable analysis only; All other variables were from the multivariable analysis.dB, decibel; NIR-FAF, near infrared fundus
autofluorescence; OCT, optical coherence tomography; ONL, outer nuclear layer. Battaglia Parodi M, et al. Transl Vis Sci Technol. 2022;11:24 Cross-sectional study of 57 eyes of 30 patients with BVMD (84% / n=48 eyes were in a clinical
stage) to determine whether lesion composition and other OCT/OCTA biomarkers predict microperimetric sensitivity Analysis of Clinical Imaging Factors on Retinal Sensitivity Hyperautofluorescence, OCT lesion type, and ONL thickness best
correlated with mean retinal sensitivity R2=0.641 | OCT lesion type and ONL thickness All P<0.05

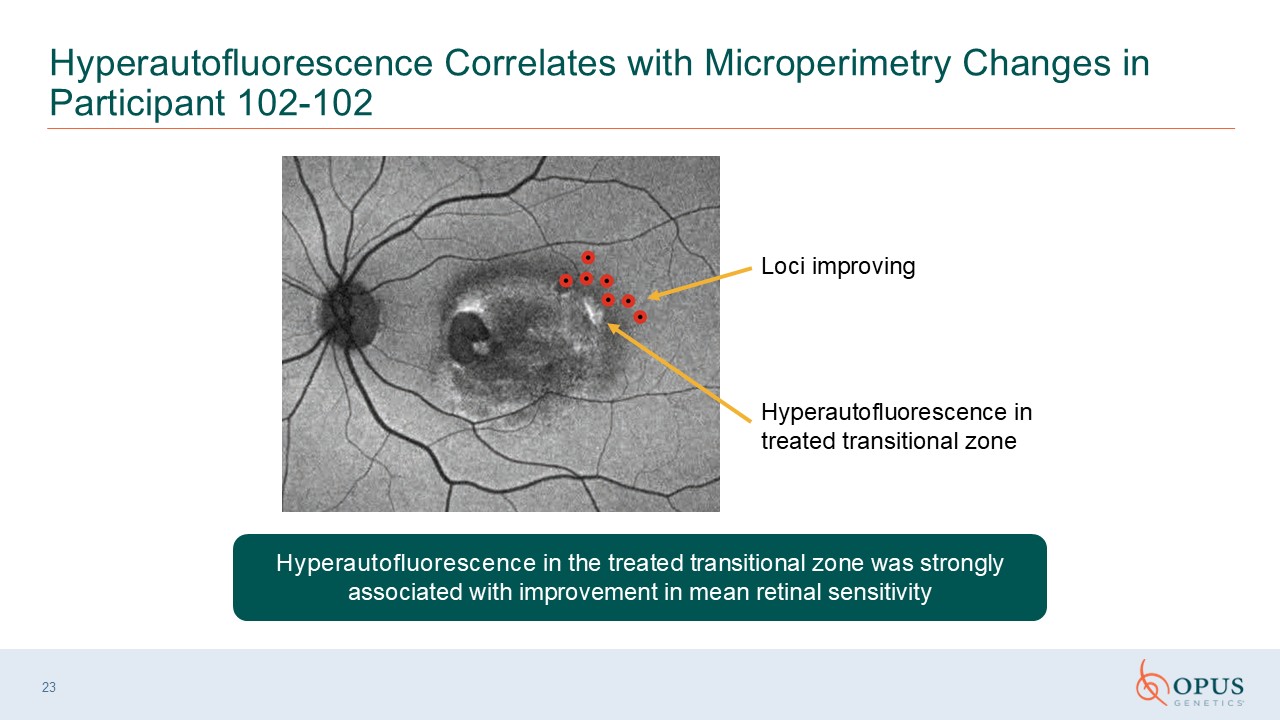
Hyperautofluorescence Correlates with Microperimetry Changes in Participant 102-102
Hyperautofluorescence in treated transitional zone Loci improving Hyperautofluorescence in the treated transitional zone was strongly associated with improvement in mean retinal sensitivity 23

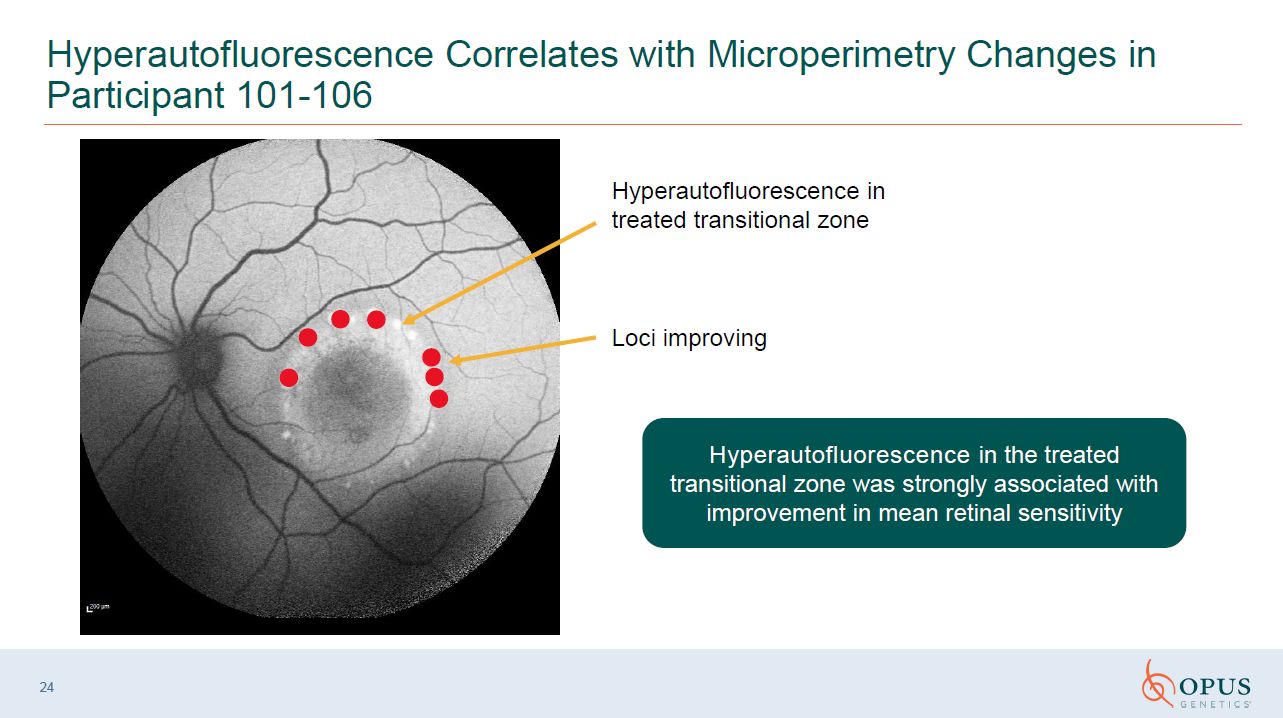
24 Hyperautofluorescence Correlates with Microperim Changes in Participant 101-106 Loci
improving Hyperautofluorescence in the treated transitional zone was strongly associated with improvement in mean retinal sensitivity Hyperautofluorescence in treated transitional zone

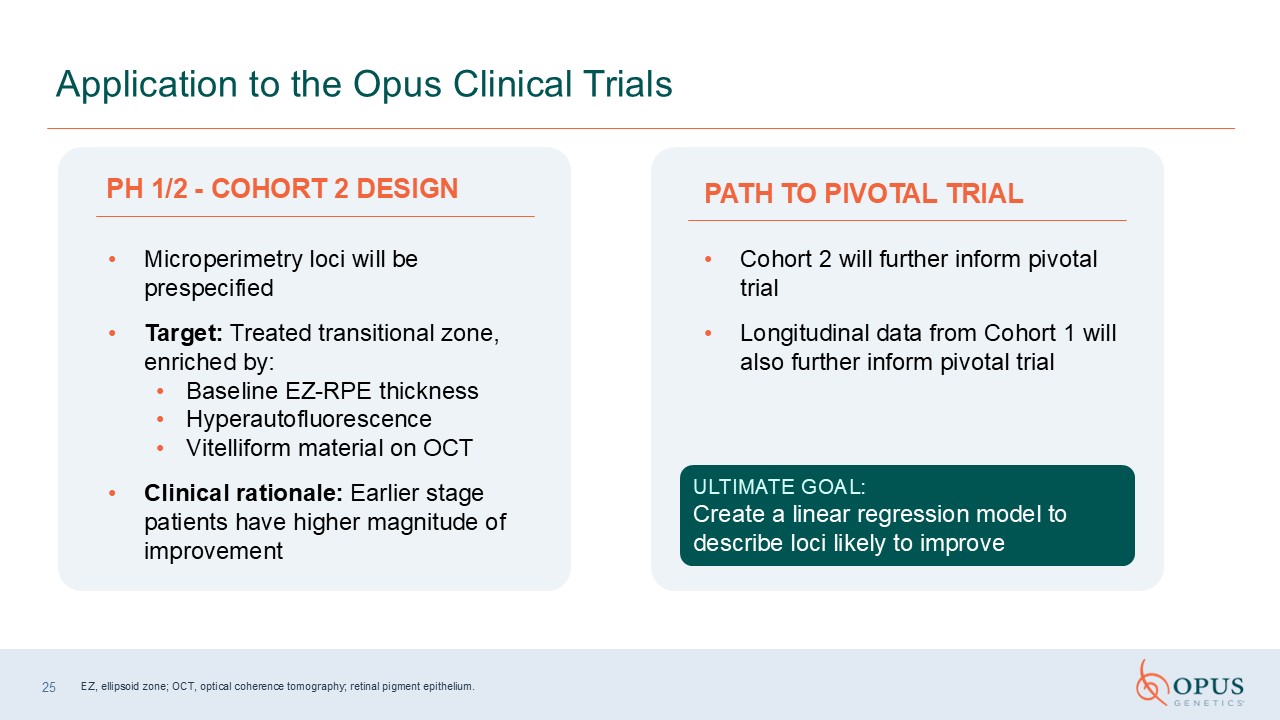
PH 1/2 - COHORT 2 DESIGN 25 Application to the Opus Clinical Trials Microperimetry loci will
be prespecified Target: Treated transitional zone, enriched by: Baseline EZ-RPE thickness Hyperautofluorescence Vitelliform material on OCT Clinical rationale: Earlier stage patients have higher magnitude of improvement Cohort 2
will further inform pivotal trial Longitudinal data from Cohort 1 will also further inform pivotal trial ULTIMATE GOAL: Create a linear regression model to describe loci likely to improve PATH TO PIVOTAL TRIAL EZ, ellipsoid zone; OCT,
optical coherence tomography; retinal pigment epithelium.